A Guide to Space, Earth Observation and Land Management

It’s World Space Week, and the theme is “Space for Climate Change.” Celebrated globally from 4-10 October, this year’s theme recognises the transformative impact of space technology against climate change through exploration and enhancing our understanding and management of Earth’s climate.

If you’re involved in land management, you may use Earth observation (EO) without knowing it. In this article, we’ve decoded the role of space and EO for individuals in land management.

What is Space?

To put it in one sentence: the space industry encompasses activities that look away from Earth (space exploration), and towards Earth (EO). 

The UK space industry is huge; the UK Space Agency and London Economics published the ‘Size and Health of the UK Space Industry 2023’ report in July 2024, stating that the total income of the UK space industry was £18.9 billion in 2023.

What is Earth Observation?

Earth Observation is the process of gathering information about the Earth’s surface, waters and atmosphere via ground-based, airborne and/or satellite remote sensing platforms (EUSPA).

The term ‘space’ may seem worlds away for many, and EO is often wrongly detached from the space industry in our minds, but EO is part of the space industry. The UK Space Agency report estimates that satellite services (within EO) support industries that contribute £109 billion to GDP (4.8%), including agriculture, transport, telecommunications, and many more.

There are quite a number of technical EO terms. Before we delve into EO applications for land management, we’ve debunked a few below.

EO and remote sensing can be confused. In short, EO encompasses all ways of collecting information about the Earth, including both remote sensing and on-the-ground methods. Remote sensing refers to gathering data from a distance, usually with satellites or aircraft.

Spatial resolution refers to the level of detail in an image, determined by the distance between pixels on the ground (Ground Sample Distance, or GSD). A smaller GSD means finer detail. 

  • Low-resolution images have a GSD of over 300 metres, sufficient for broader applications like weather forecasting.
  • High-resolution images have a GSD of below 5 metres - common for public satellite data. 
  • Commercial satellites and UAV photogrammetry (such as drones) can have a very high-resolution GSD range between 1 to 2.5 cm.

Higher-resolution images are useful for detailed tasks like precision agriculture, but they are more expensive and generate larger files, making them better suited for smaller areas.

Revisit time refers to how long it takes for a satellite to observe the same area again. This time varies depending on the satellite's orbit and agility. Most EO satellites are in Sun-synchronous orbits, which help maintain consistent lighting for images. Revisit time is shorter near the poles and longer at the equator. To reduce waiting times, multiple satellites or agile satellites that can adjust their view are used. 

For example, Sentinel-2 consists of two identical satellites Sentinel-2A and Sentinel-2B. The satellites are on opposite sides of the Earth (180° to each other), in a sun-synchronous orbit. Each individual satellite has a revisit time of 10 days, therefore the overall revisit time of Sentinel-2 is 5 days.

Spectral bands refer to different ranges of light or energy that sensors on remote sensors can detect. These bands capture energy from various parts of the electromagnetic spectrum, like visible light (what we see), infrared, or ultraviolet light. Multi-spectral imaging means using sensors that can detect several different spectral bands at once. For example, a multi-spectral satellite might capture images in red, green, blue, and infrared bands. Each of these bands gives us different information about Earth's surface, like the health of vegetation, water quality, or soil conditions.

Linking Space, Earth Observation and Land Management

To break down the use of EO for monitoring land cover, here are some examples of different public data layers in the Rethink Platform, the remote sensing techniques they are derived from, and the information they show. 

Data layer: OS Terrain® 50
By: Ordnance Survey
Remote sensing method: Aerial imagery (supplemented by ground EO techniques)

Information: This data layer is a digital terrain model (DTM) showing the ground surface height of Great Britain. On the map overlay, the visualisation of contours and grid height points also comes with associated height data.

OS Terrain® 50
OS Terrain® 50 in the Rethink Platform on the 3D dark map. Contains OS data © Crown Copyright and database right 2024.

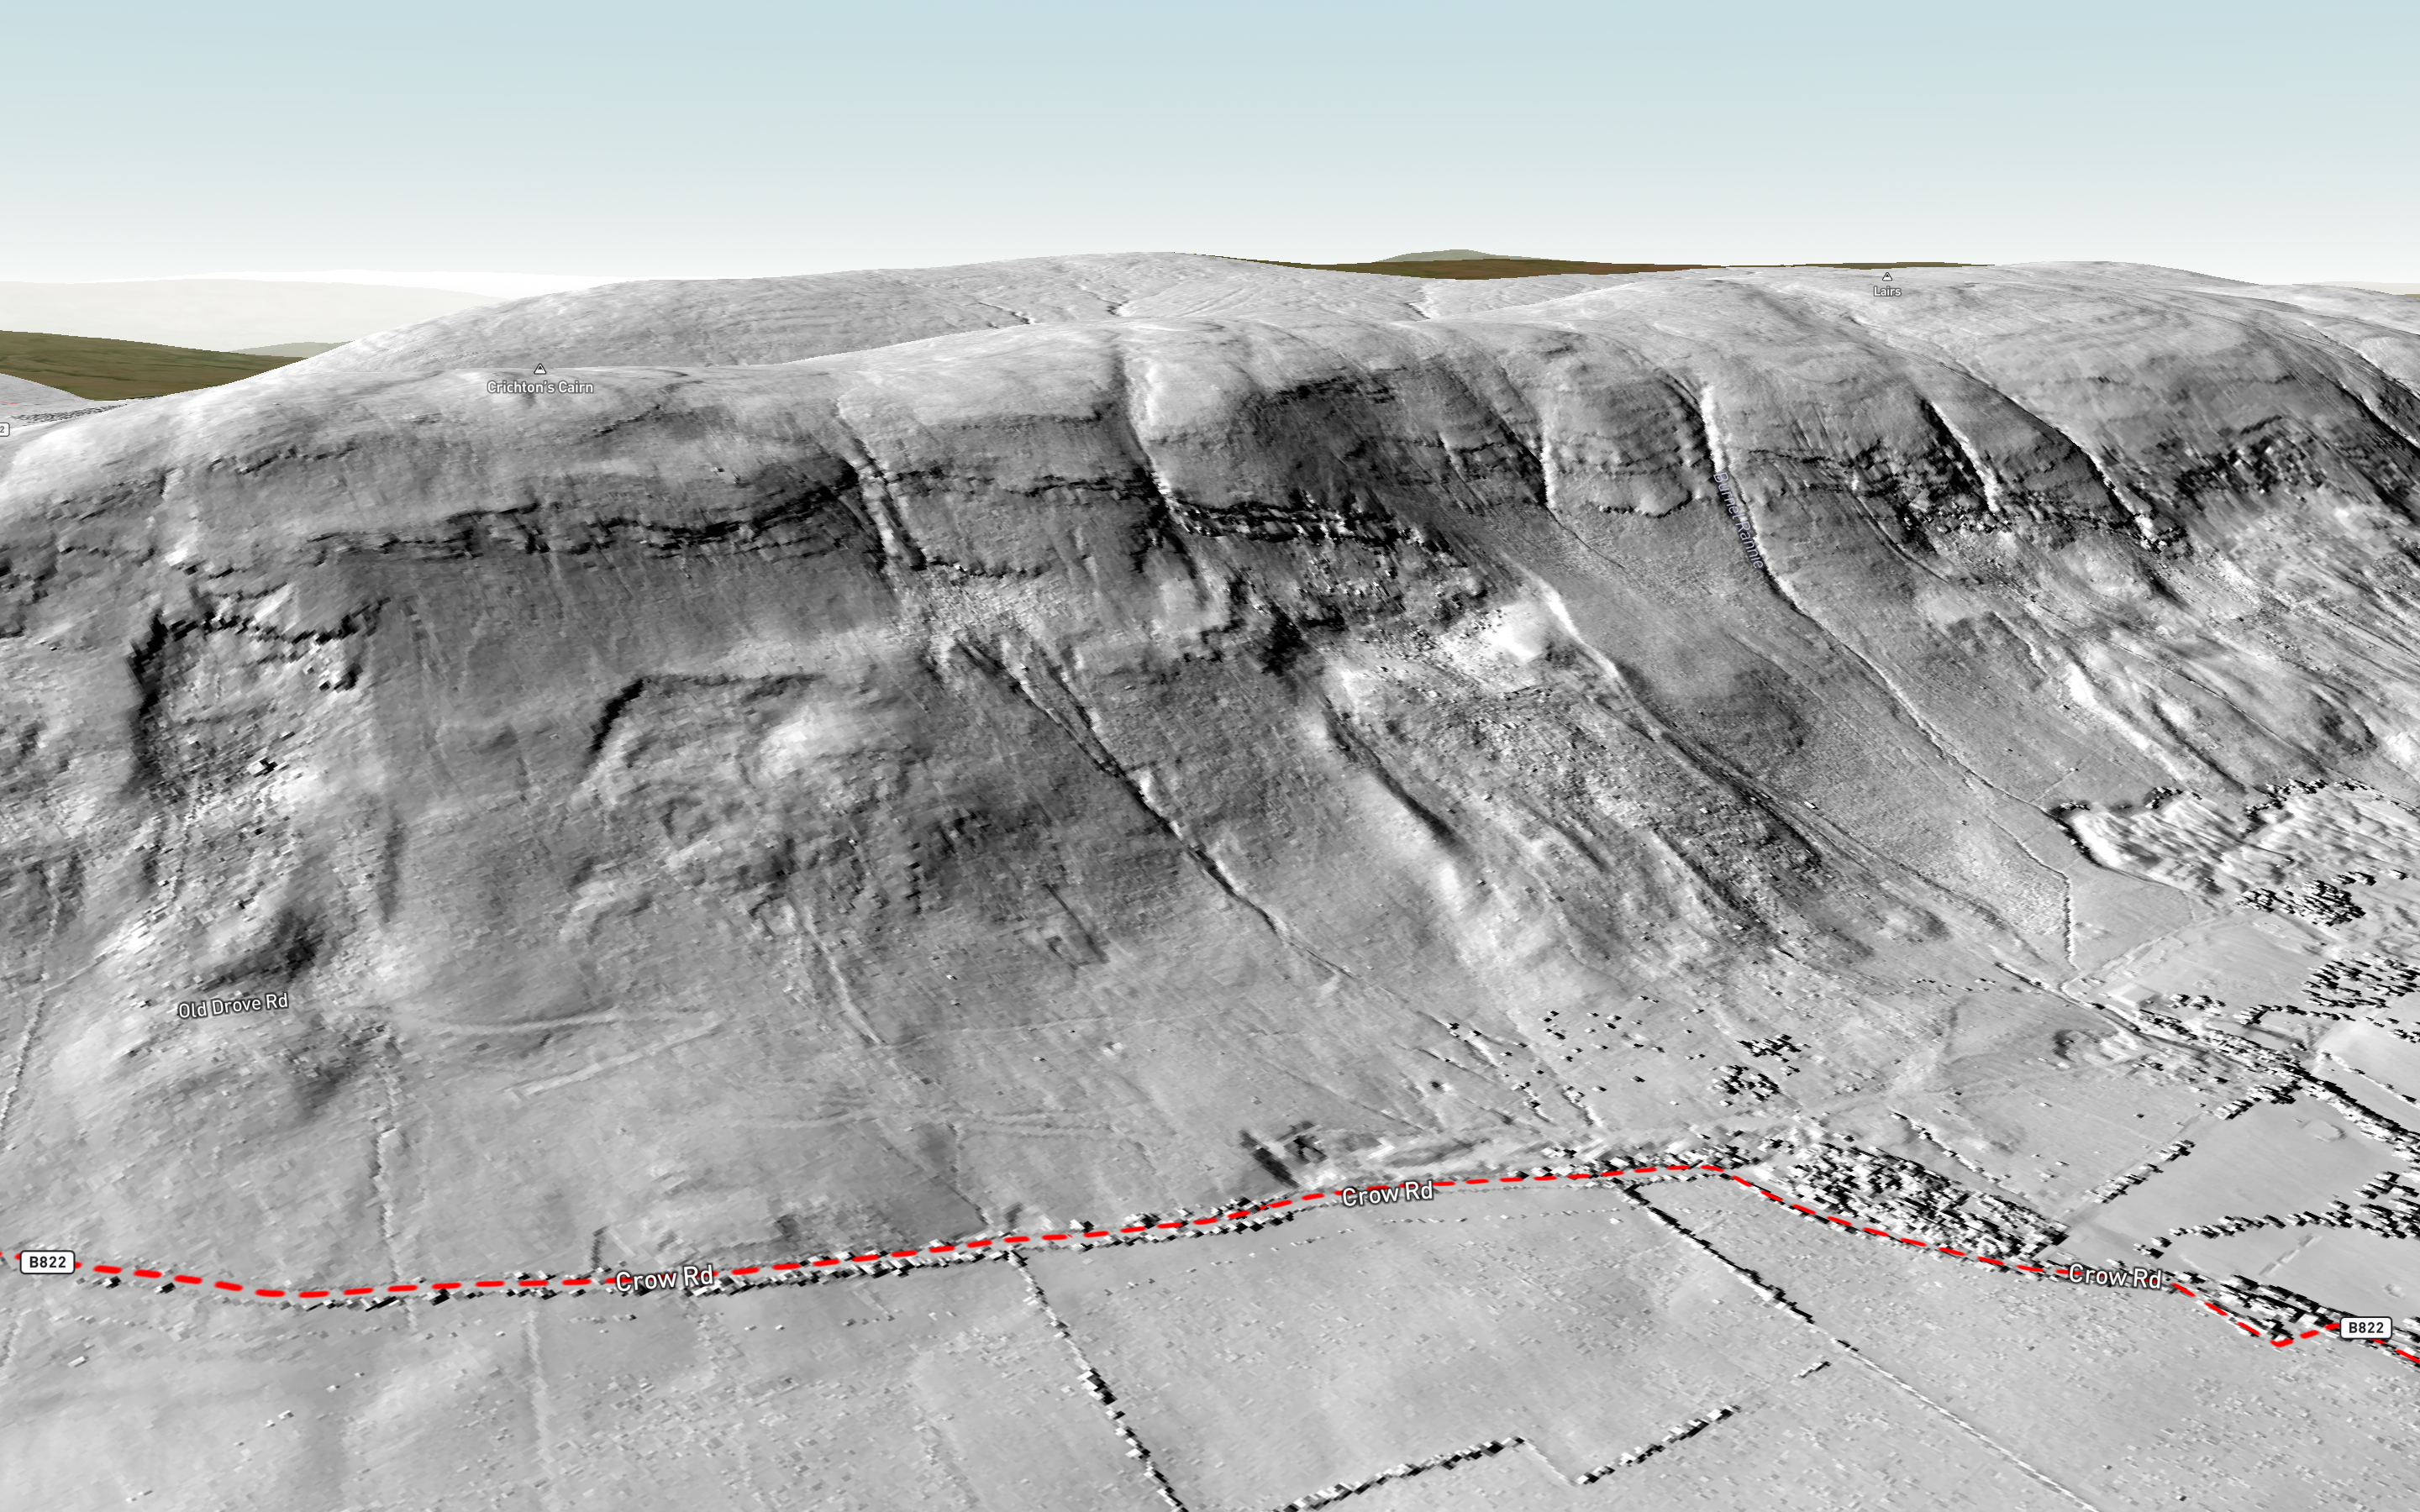
Data layer: Lidar Phase 5 Digital Surface Model (DSM)
By: Fugro, supplied by the Scottish Government
Remote sensing method: Airborne LiDAR

Information: This DSM provides a very high-resolution surface height data layer. This differs from ground terrain height as the DSM detects the highest point from the Earth’s surface, such as a tree or building.

Lidar Phase 5 DSM
Lidar Phase 5 DSM in the Rethink Platform. Crown copyright Scottish Government and Fugro (2020).

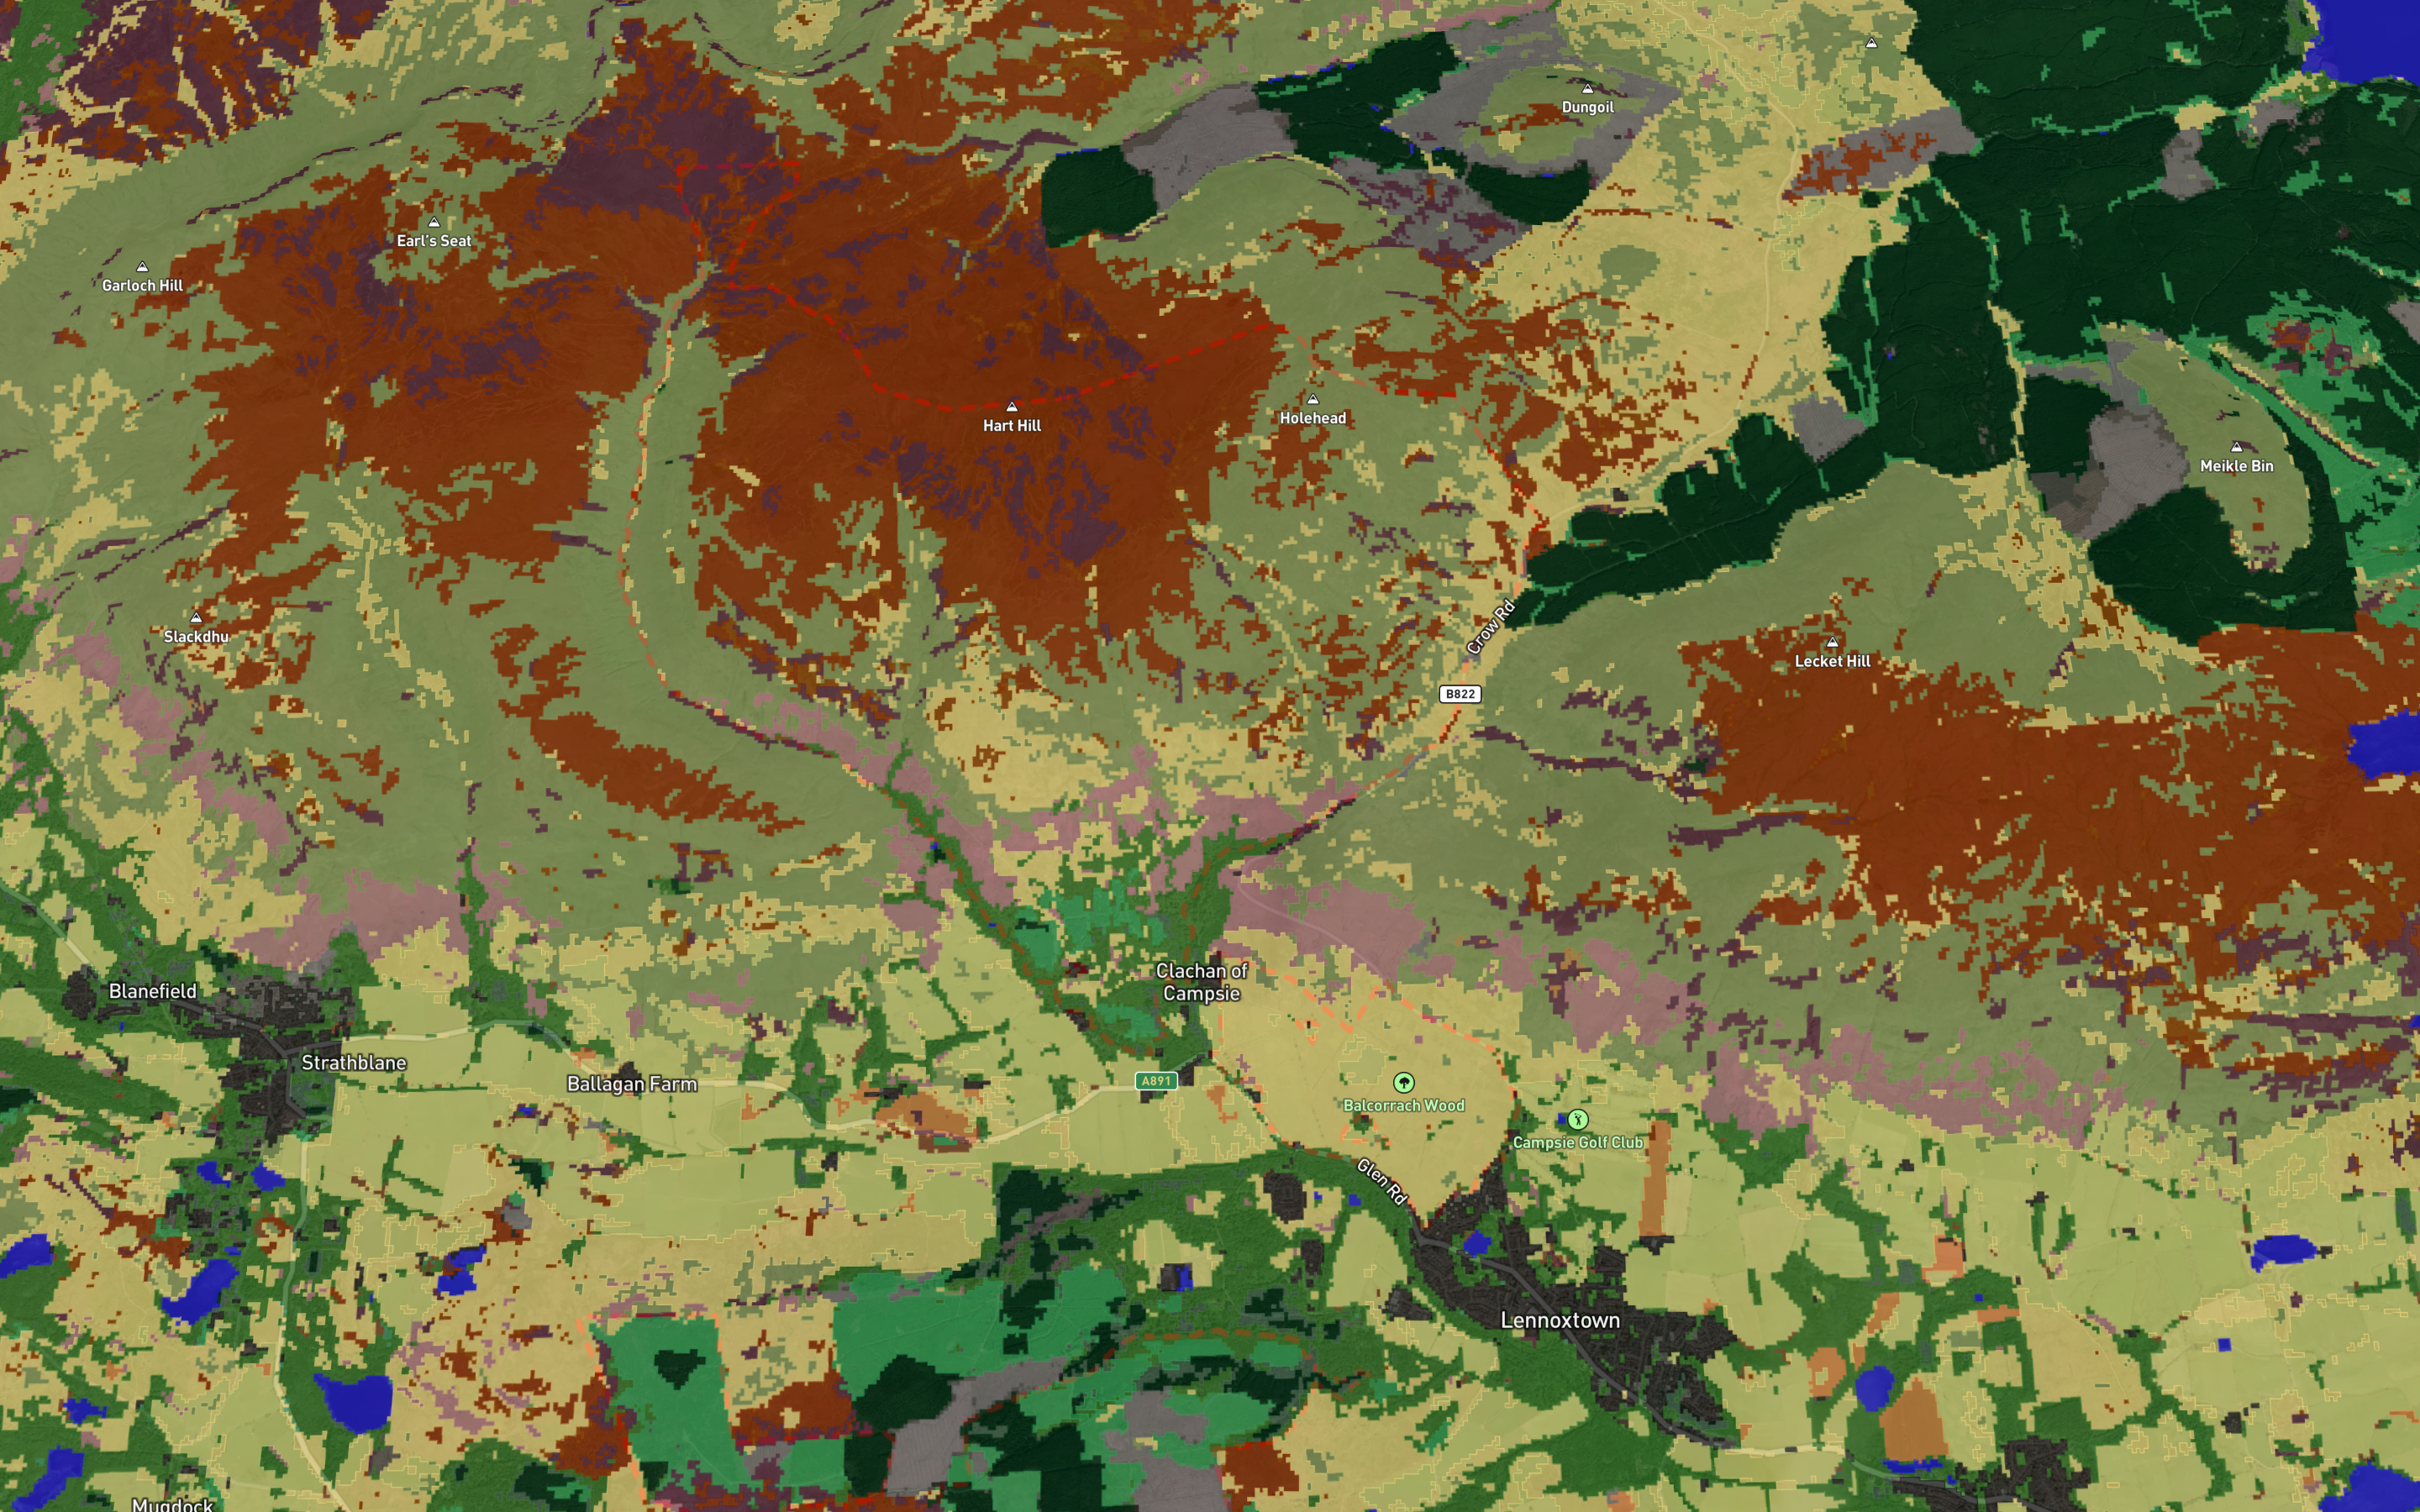
Data layer: Habitat and Land Cover 2022
By: Space Intelligence in partnership with NatureScot
Remote sensing method: Satellite (Optical Sentinel-2 (S2), SAR Sentinel-1, and ALOS-PALSAR 2), supplemented by machine learning

Information: This data layer provides detailed classifications of habitats and land cover types over Scotland, categorised into EUNIS level 1 and level 2 classification.

Habitat and Land Cover 2022
Habitat and Land Cover 2022 in the Rethink Platform on the satellite map. Contains public sector information licensed under the Open Government Licence v3.0.

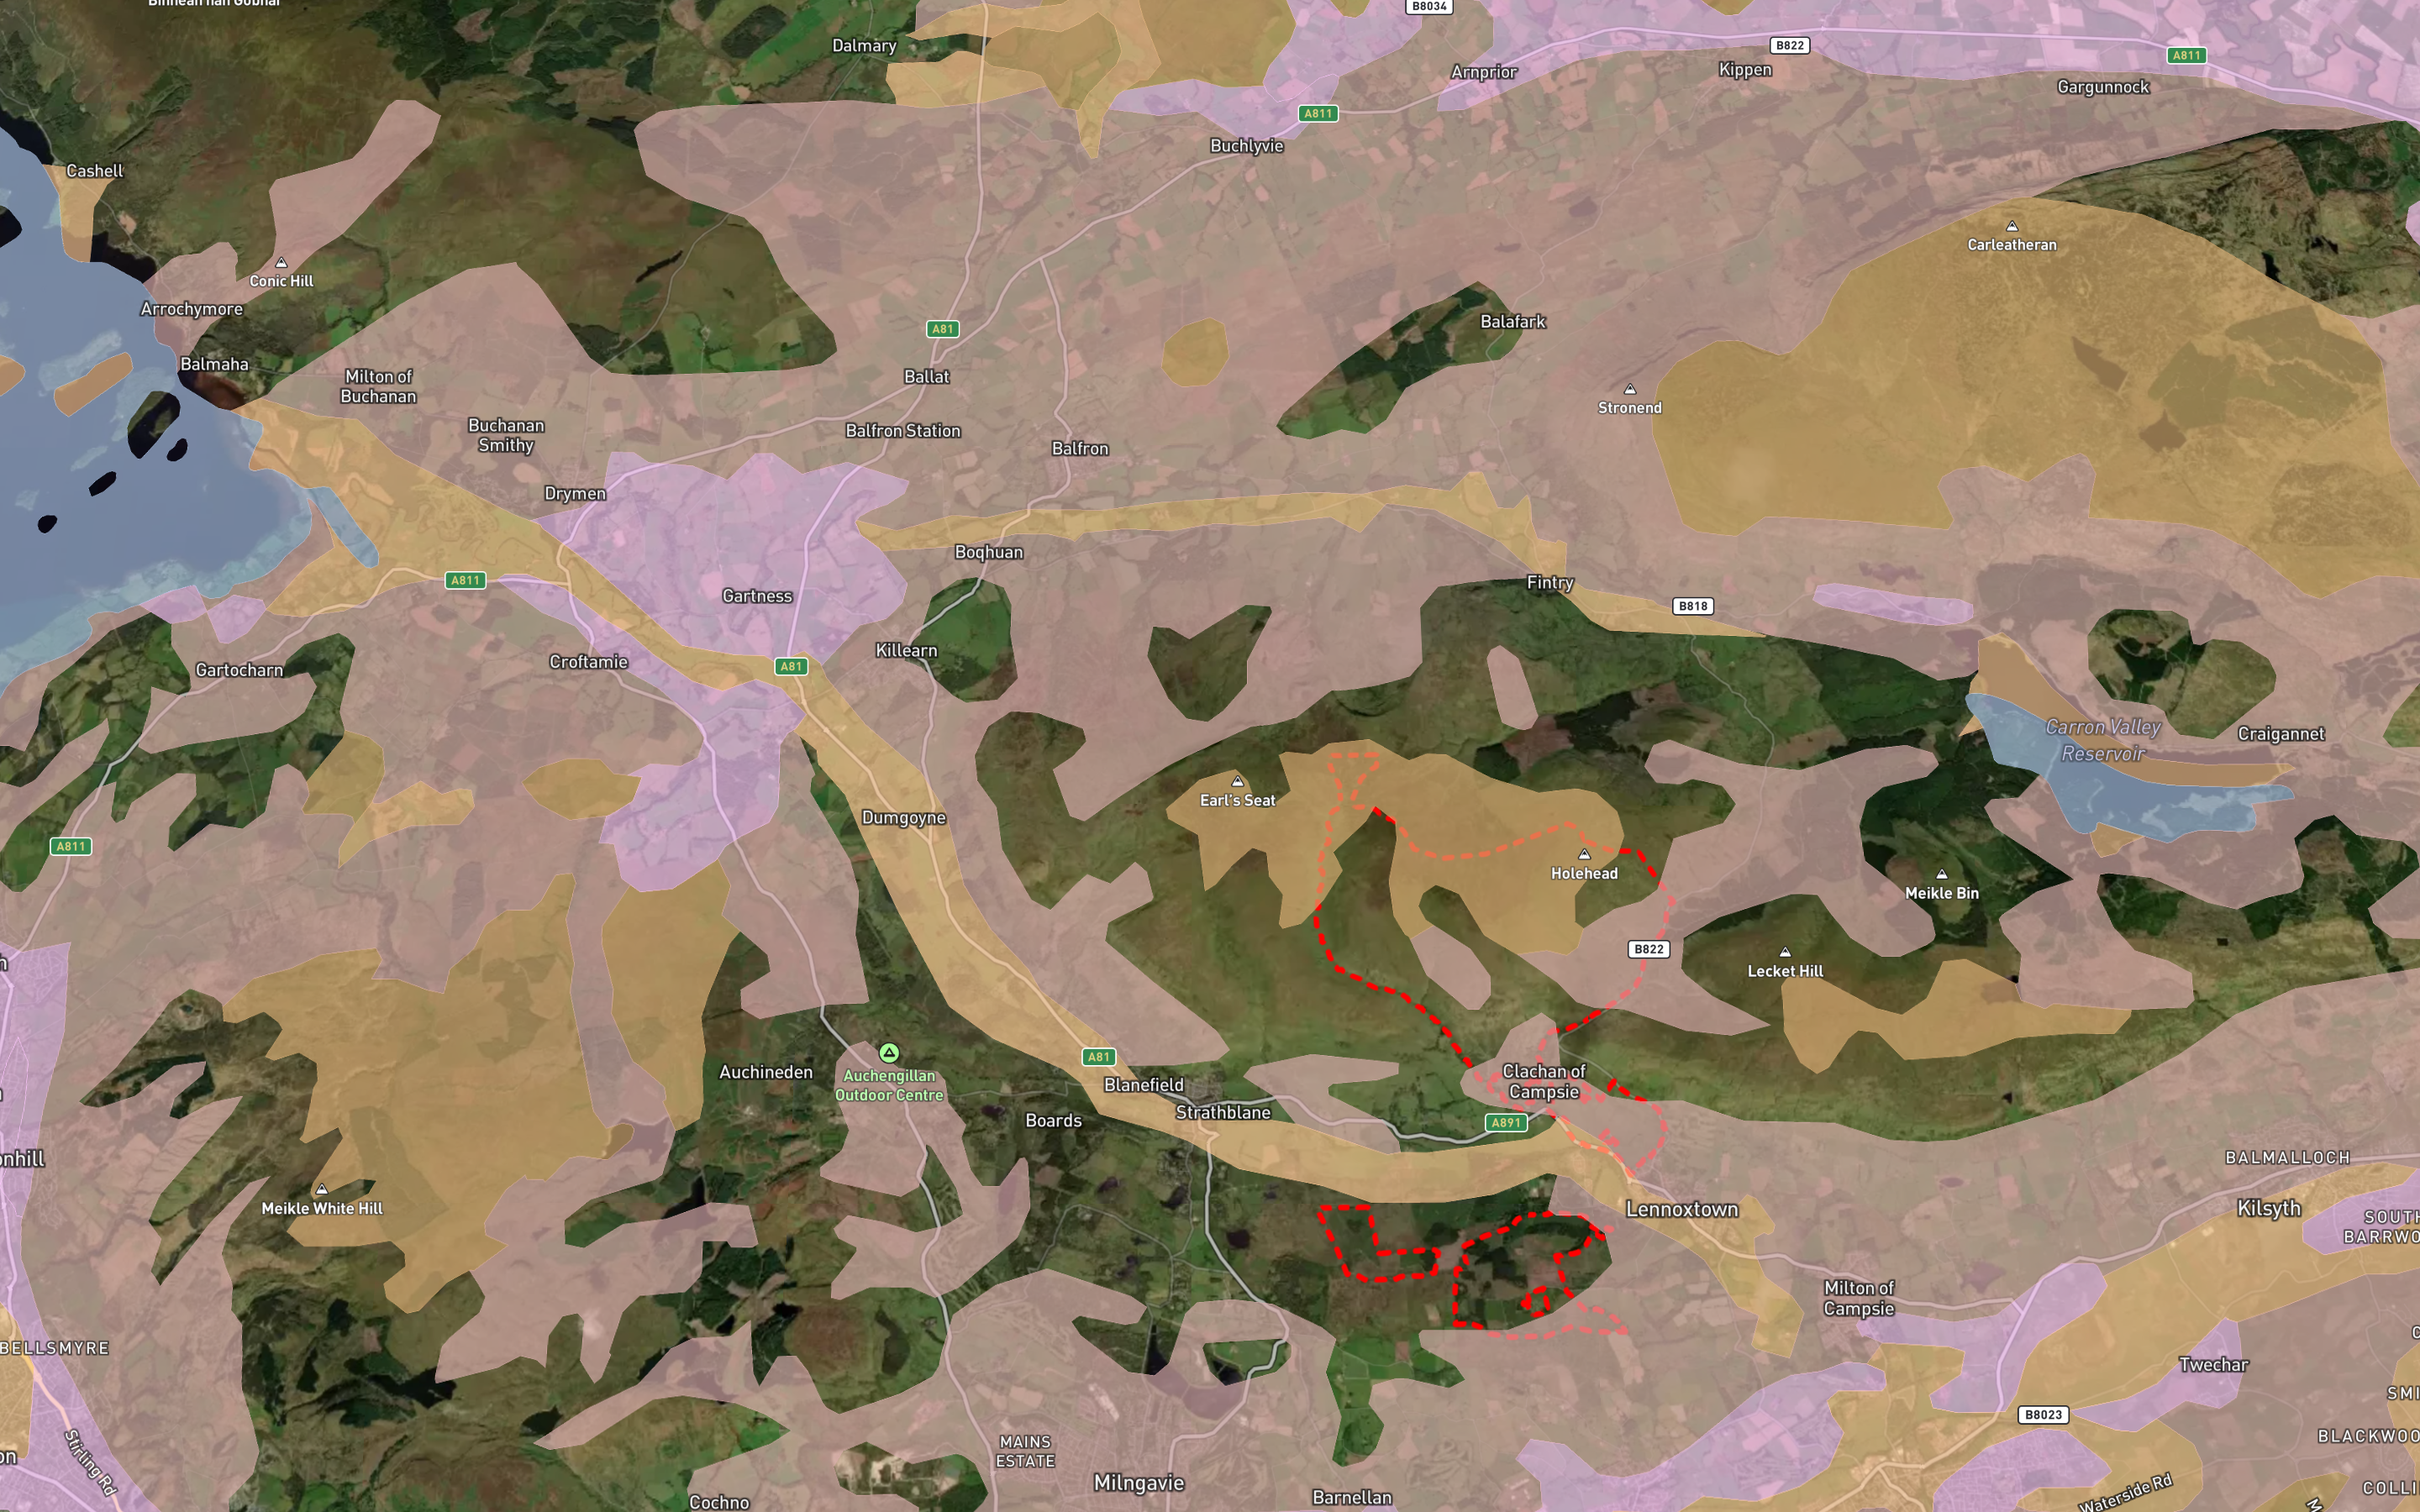
Data layer: BGS Superficial
By: British Geological Survey (BGS)
Remote sensing method: Satellite (Landsat 7 and 8, Sentinel-2), aerial photography, and LiDAR, supplemented by geographical field surveys

Information: BGS Superficial is a detailed map of Great Britain’s superficial geology on a 1:625,000 scale.

BGS Superficial / BGS Geology 625k
BGS Superficial in the Rethink Platform on the satellite map. Contains British Geological Survey materials © UKRI 2024.

Data layer: Peatland Normalised Difference Moisture Index (NDMI)
By: Rethink Carbon
Remote sensing method: Sentinel-2

Information: The NDMI map identifies the amount of moisture in soils, with low scores (- 1 to -0.1) highlighting areas of bare soils or areas experiencing water stress (shown in dark red), and higher scores identifying moister soils (shown in light red).. This layer is specific to peatland, identifying NDMI scores within Class 1 and Class 2 of NatureScot’s Peatland and Carbon Class 2016 layer.

NDMI
NDMI in the Rethink Platform on the 3D satellite map. Contains NatureScot information licensed under the Open Government Licence v3.0. Additional acknwoledgment: The Carbon and Peatland 2016 map is based on soil and land cover map data produced by the James Hutton Institute. Used with the permission of The James Hutton Institute. All rights reserved.

EO data is informative and visually engaging, opening up data to new audiences. While a lot of EO data is available publicly, there are still limitations. Once finding and downloading the data, remote sensing and Geographic Information Systems (GIS) software platforms are often needed to interpret and visualise the data in a desired manner, requiring experienced remote sensing and GIS professionals to analyse complex datasets.

In the Rethink Platform, we empower all of our users to use spatial datasets for sustainable land management. In just seconds, over 125 datasets are analysed over an area of land, informing users about the natural capital and ecosystem services on the land.

Hopefully, space and Earth observation don’t seem worlds away!

Leave your details and we’ll be in touch! 

£99

Included with the
Premium Insights upgrade.

Visualise the Future of land use with
our scenario builder.

Scenario planning, natural capital reporting, AI Discovery and much more included with the Premium Insights upgrade.

Natural Capital
Reporting

included

Enhanced Opportunity
Mapping

Included

Scenario planning
Workspaces

included

AI Powered
Discovery

Included

Our Workshops

A short introduction to the workshop instructors and why their background should inspire potential student’s confidence.